
Normally if I have a chart that I want to add to a Word document, I create it in Excel and then copy and paste it over. However, Word has a decent charting function that makes it pretty easy to add basic charting on the fly.
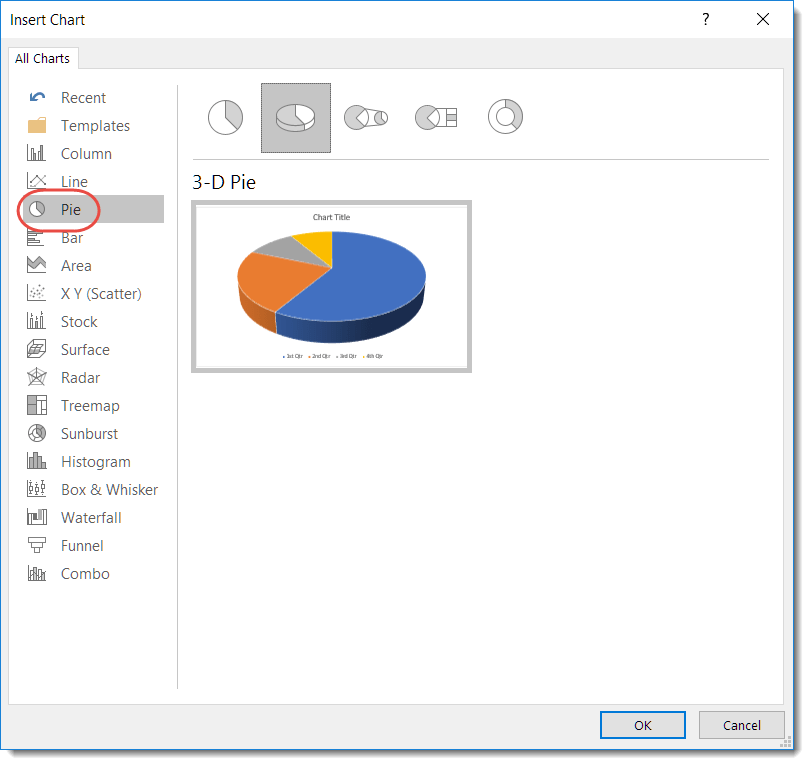
To create the chart, go into the Insert tab on the Ribbon Bar and select Chart:

The dialog box will give you a wide selection of charting styles to choose from. In this example, I picked a Pie Chart using the 3-D version:
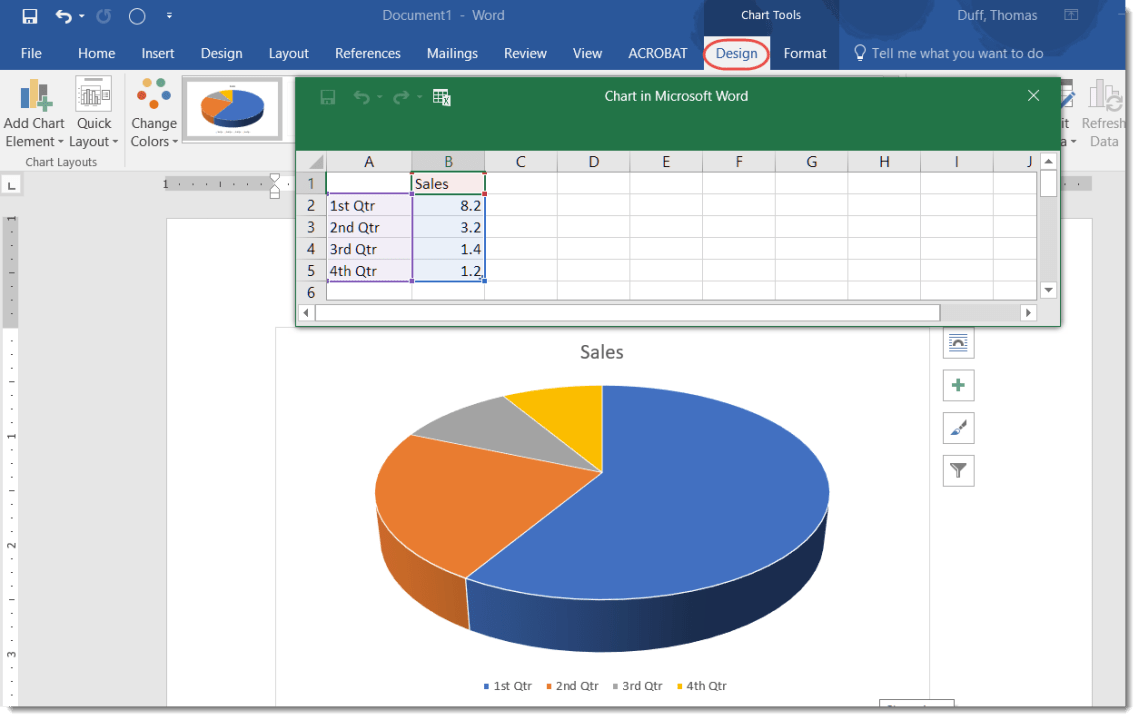
A small Excel spreadsheet will launch within Word, and it will have some sample data that corresponds to the actual sample chart that’s been added to Word:
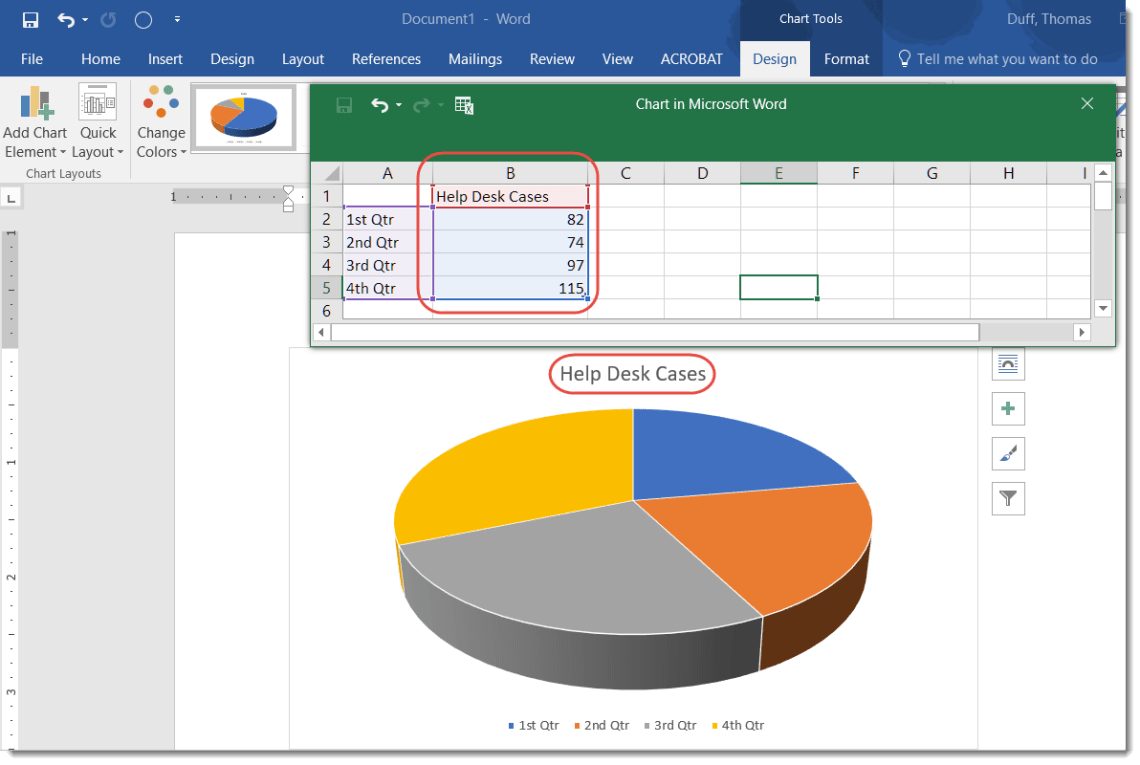
You can add or modify the Excel data to reflect the type of information that you’re working with, and those changes will show up instantly on the chart. In this case, I changed the data from Sales to Help Desk Cases:
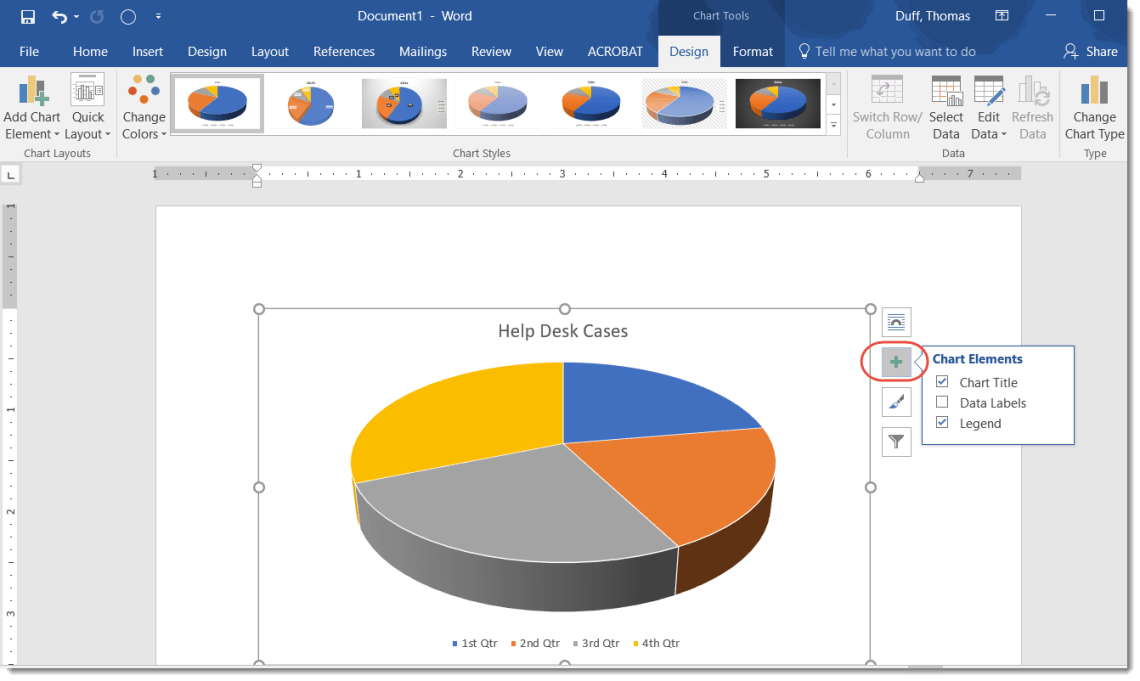
Once you’re done changing the data, you can close the Excel spreadsheet. You can then use the Charting Elements button to fine-tune the look and feel of the chart display:
This definitely isn’t a full-on replacement for complex charting that should be done in Excel. But for those times when a quick chart would add context to information, it’s nice to know you don’t need to leave Word to make that happen.
