
SharePoint has always provided some level of site analytics to see site traffic, most popular pages, etc. However, there wasn’t a great way to drill into analytics for a particular page. Those types of statistics are now available using the Analytics feature on SharePoint Online modern pages and news posts. Here’s how that works…
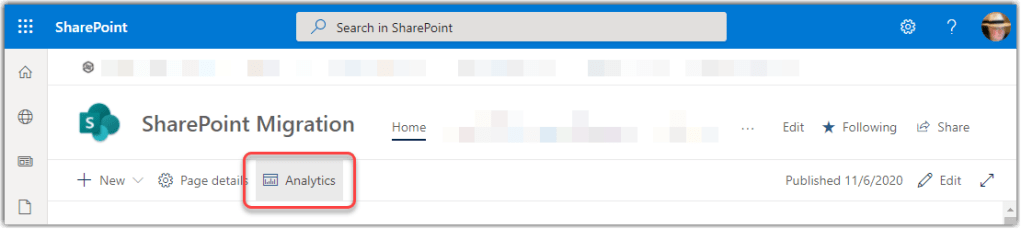
On a modern page/news post, you should see the Analytics button on the page menu bar:
A Page Analytics panel will appear on the right side of your screen, showing Page viewers, Page views, Average time spent per users, and Page traffic by time. You have the option to show the last 7, 30, or 90 days, and there’s a little clock icon that, when hovered over, will show the lifetime Page viewer and Page view counts:


While this is a good step up from what had been there before, there are still some significant deficiencies in my opinion:
- 90 day statistics are not available for the Page viewers and Average time spent per user analytics, even though you can click on the 90 day option. I have no idea why…
- 7, 30, and 90 day analytics are your only options. You can’t go back any further.
- There’s no feature to export the data to Excel if you wanted to “build your own” analytics over a longer period of time.
I usually preface an explanation of this feature with “what you see is what you get,” as I almost always get asked if the analytics can provide more than what you see here. At least at this time, the answer is… no.
For the Microsoft explanation of this feature, check out View usage data for pages and news.
